Insights Dashboard
Introduction
The Insights Dashboard displays dynamic views via tables, charts and lists that show metrics related to application, dealer, user, process and other useful data points, organized within various tabs.
Within the dashboard, users are able to adjust the date ranges and common filters relevant to the information that they wish to see. The data from the selected timeframe is presented in several different tabs:
- Executive Summary
- Credit Verifications Deepdive (includes Income information)
- AutoFund Verifications Deepdive
- Dealer Management
- Dealer Scorecard
- Extractions Data Downloads
- Application Lookups
- CollectIQ Metrics
- DealerVerify Monitoring
- Human-In-The-Loop (HITL) Monitoring
- Operational Metrics
The Insights Dashboard is accessible from the home page of the VerifyIQ user interface for those with the appropriate role assigned. A role of manager is required to view the Insights Dashboard.
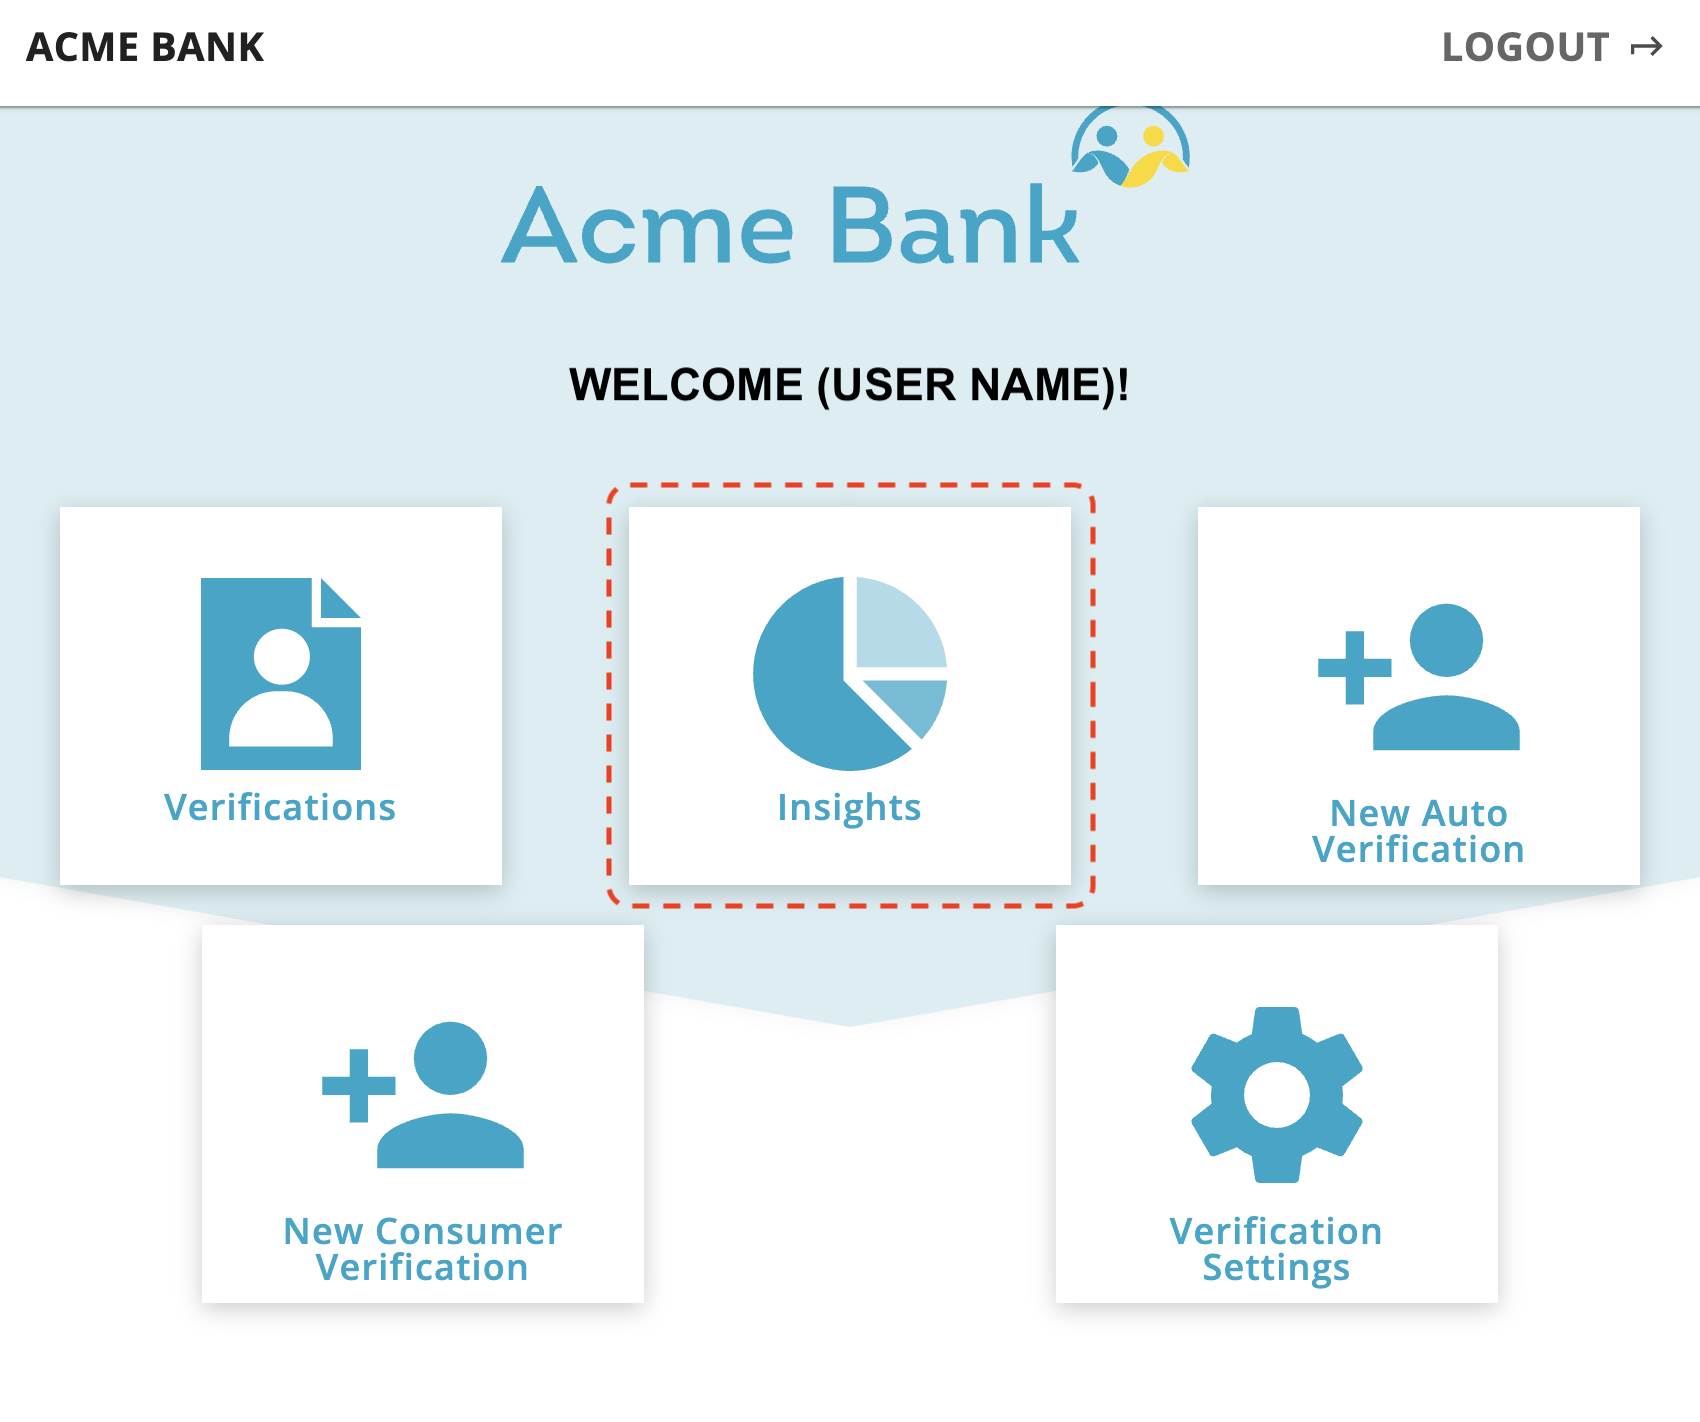
Select the Insights button in order to be directed to the Insights Dashboard Executive Summary page, where you will see a page with a row of tabs similar to the below image.
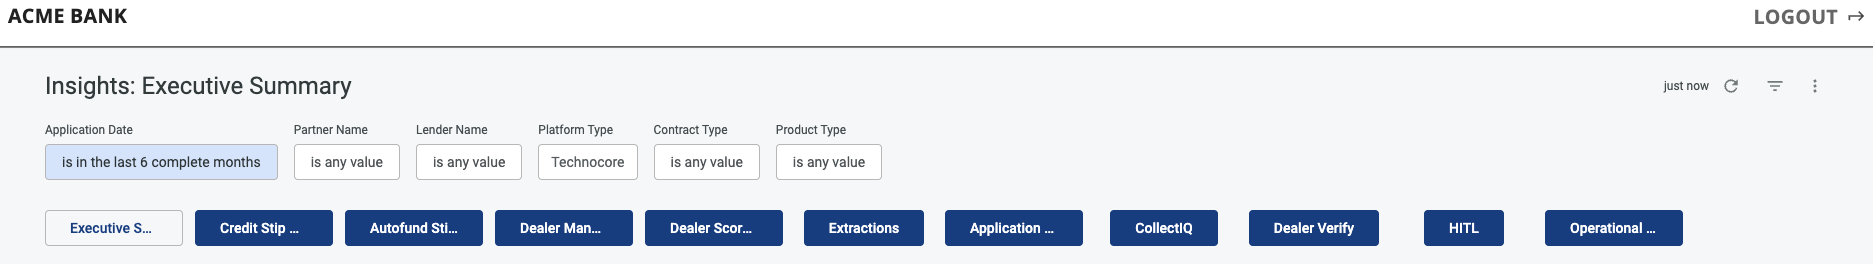
The content of these different tabs is described in the following sections.
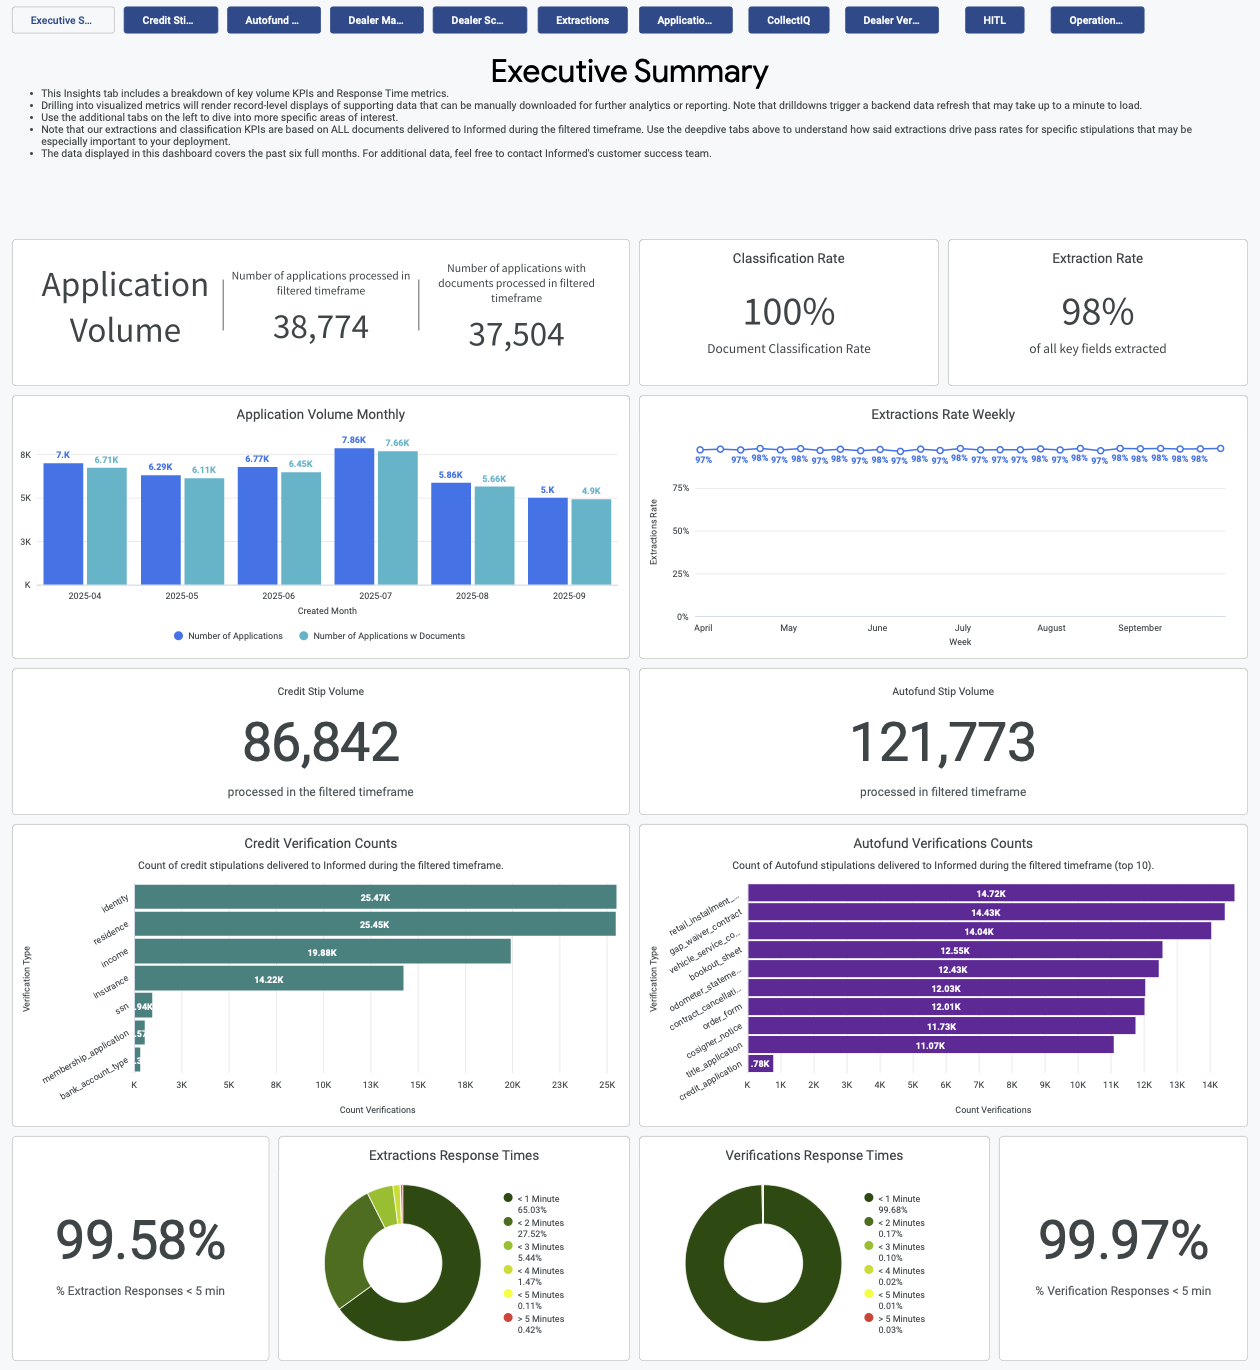
Executive Summary
The Executive Summary tab highlights total application volume, stipulation volume, extraction and classification rates and response times for extractions and verification API responses. It is especially useful in monitoring for improvements in extraction and classification rates early in the life of a partner launch as our platform's machine learning models get trained on new documents being submitted.
- Application Volume Monthly
- Extractions Rate Weekly
- Credit Verifications Counts
- AutoFund Verifications Counts
- Extractions and Verifications Response times
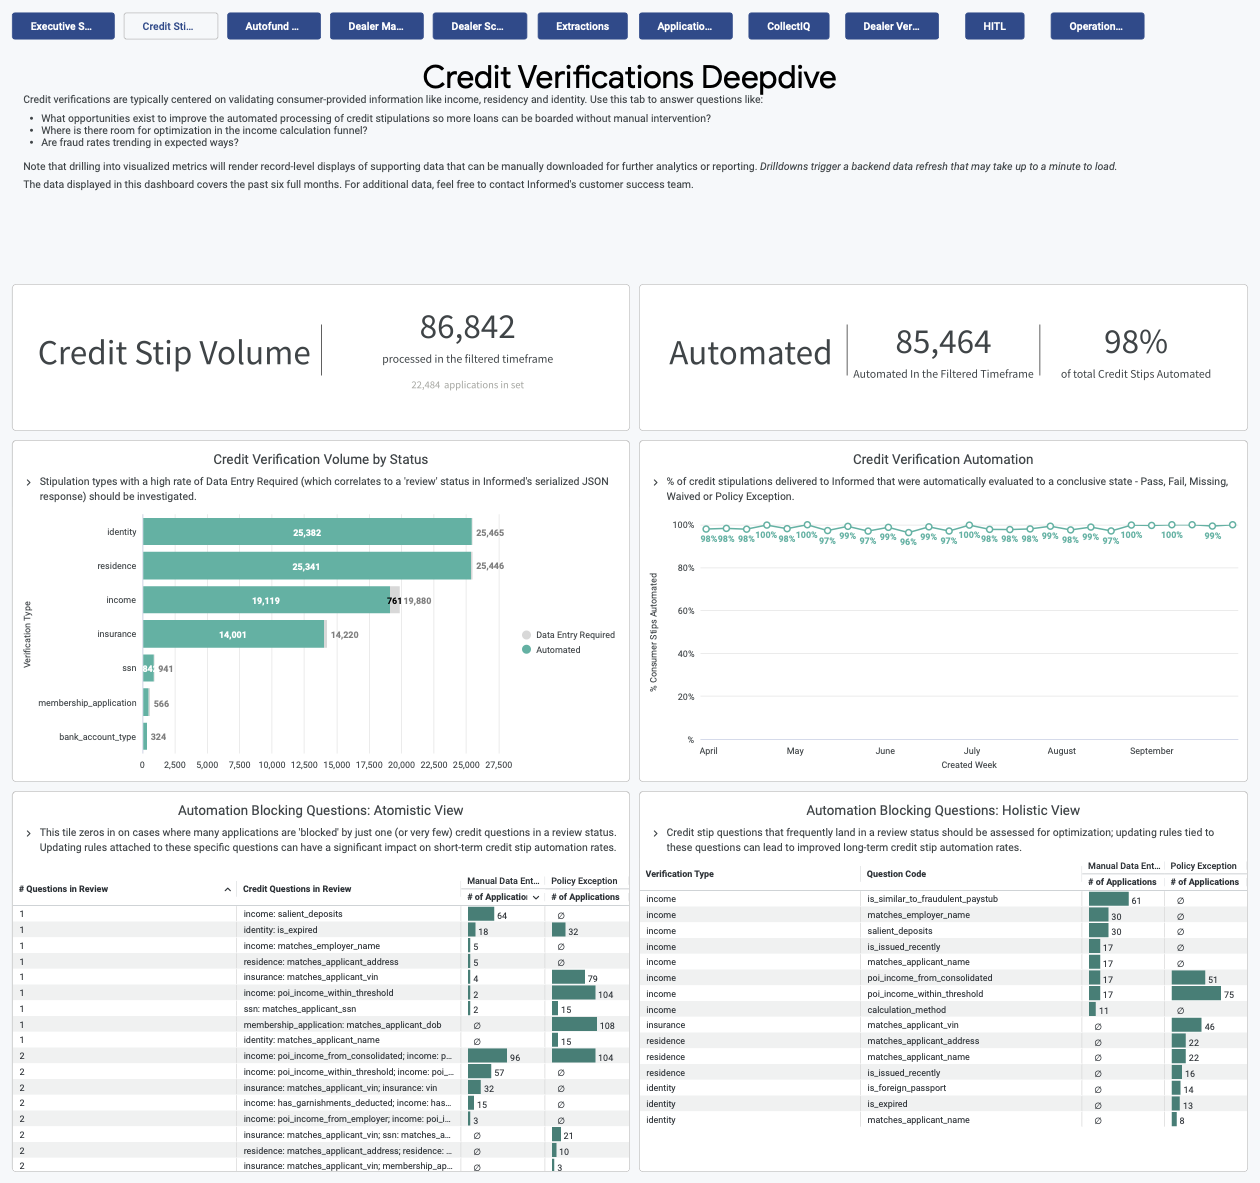
Credit Verifications Deepdive
The Credit Verifications Deepdive tab is designed to streamline the process of analyzing data as it pertains to stipulations on consumer-provided information such as income, residency and identity and their impact on straight-through processing of applications. Its primary purpose is to provide insights and answers to critical questions such as identifying opportunities for enhancing automated credit stipulation processing.
- Credit Verification Volume by Status
- Credit Verification Automation
- Automation Blocking Questions:
- Atomistic View
- Holistic View
By drilling down into the two Automation Blocking Question charts, you can identify specific questions or stips that are being blocked from automation and review policies and guidelines to understand if these questions need to be verified by Informed in order to fund a loan. In the drilldown reports there is a link directly to the specific application and document within VerifyIQ so that reviewing defects can be done quickly.
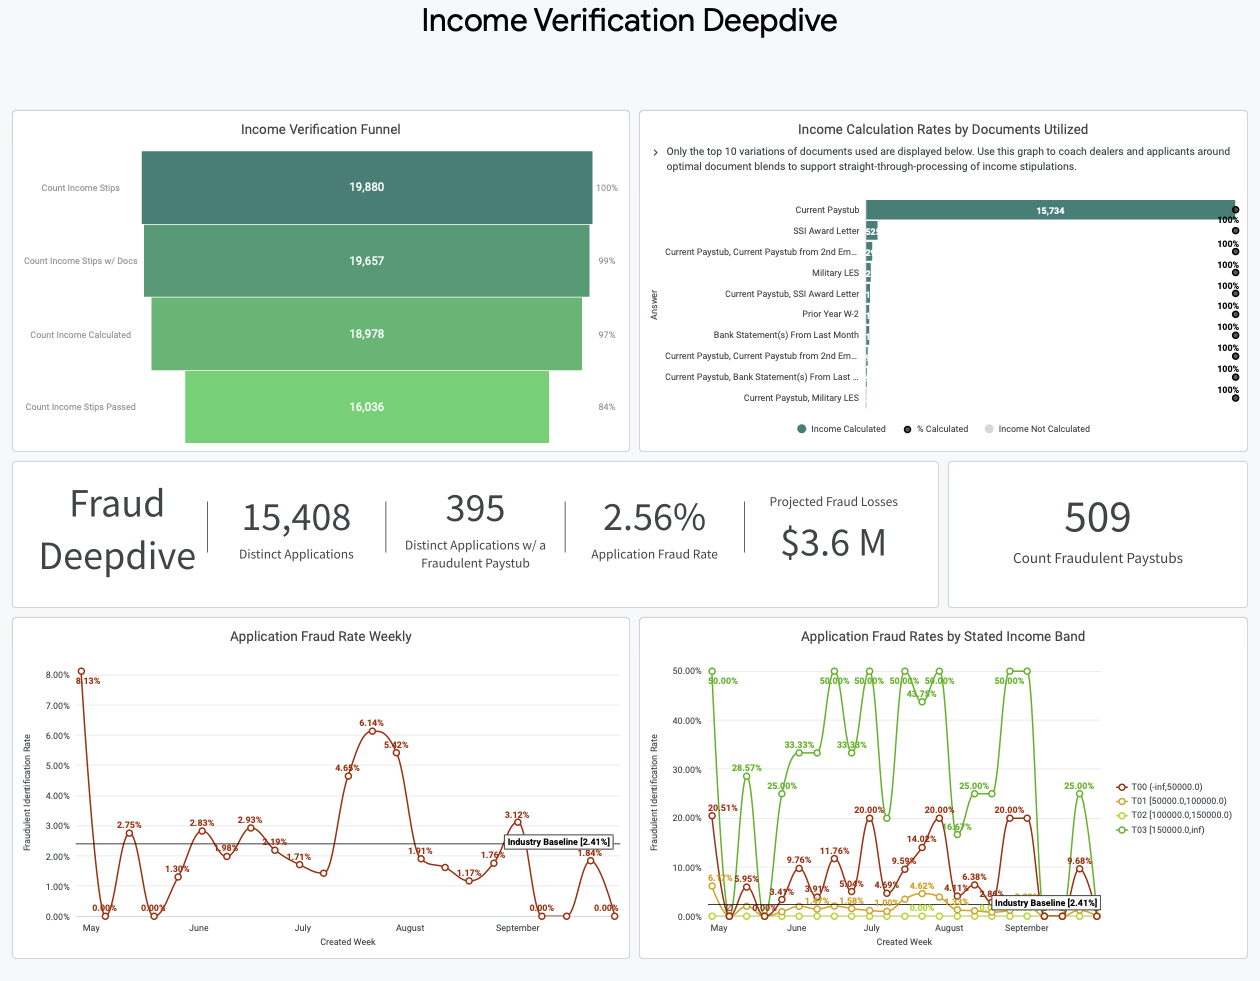
The Income Verification Deepdive dashboards can be found in the bottom half of the view. These tables pinpoint areas in the income calculation funnel that offer potential for optimization and monitor for any unexpected changes in fraud patterns.
- Income Verification Funnel
- Income Calculation Rates by Documents Utilized
- Application Fraud Rate Weekly
- Application Fraud Rates by Stated Income Bands
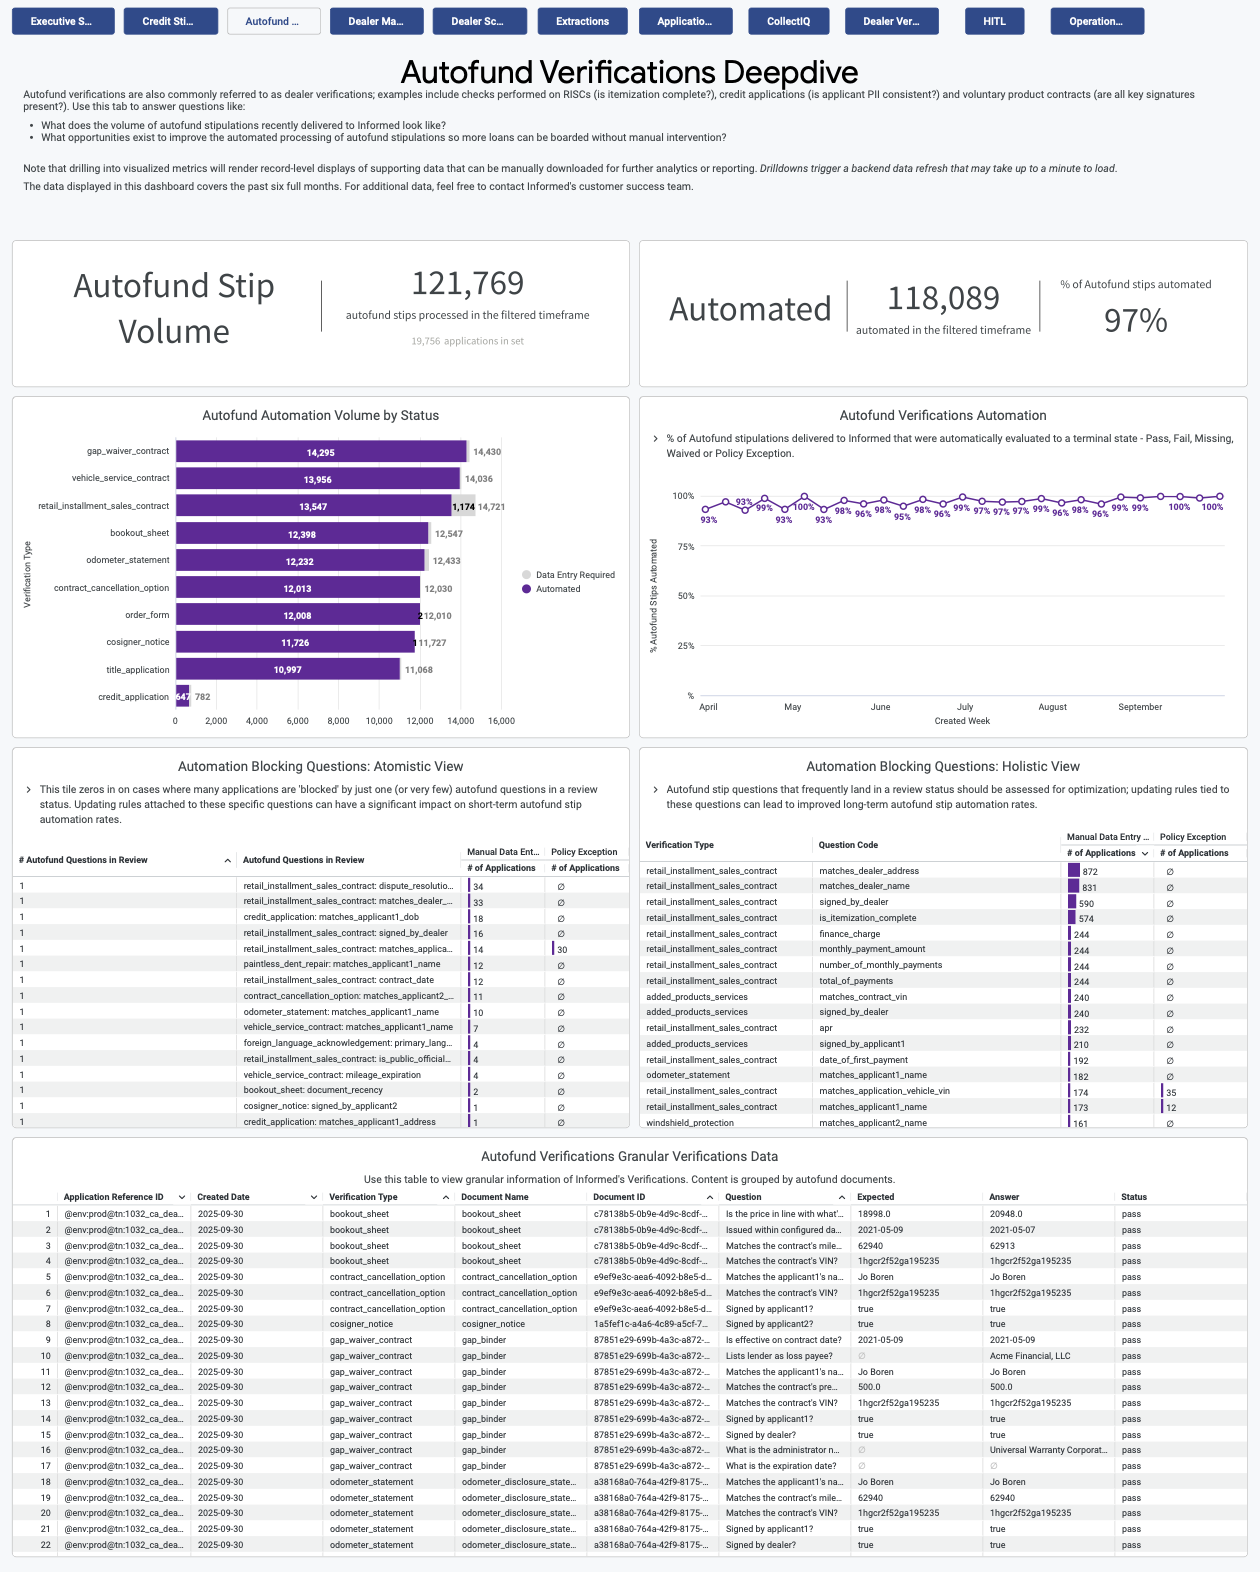
AutoFund Verifications Deepdive
The AutoFund Verifications Deep Dive tab provides a high level summary of data pertaining to dealer stipulations. These stipulations encompass a range of checks conducted on documents such as Retail Installment Sales Contracts (RISC's), credit applications and voluntary aftermarket product contracts to ensure document completeness, compliance and accuracy. Similar to the Credit Stip Deep Dive tab, we surface the frequency in which we see certain verification types and questions requiring manual intervention and blocking full stip automation to highlight the biggest bottlenecks to straight-through processing.
- AutoFund Automation Volume by Status
- AutoFund Verifications Automation
- Automation Blocking Questions
- Atomistic View
- Holistic View
- AutoFund Verifications Granular Verifications Data
By drilling down into the two Automation Blocking Question charts you can identify specific questions or stips that are being blocked from automation and review policies and guidelines to understand if these questions need to be verified by Informed in order to fund a loan. In the drilldown reports there is a link directly to the specific application and document within VerifyIQ so that reviewing defects can be done quickly.
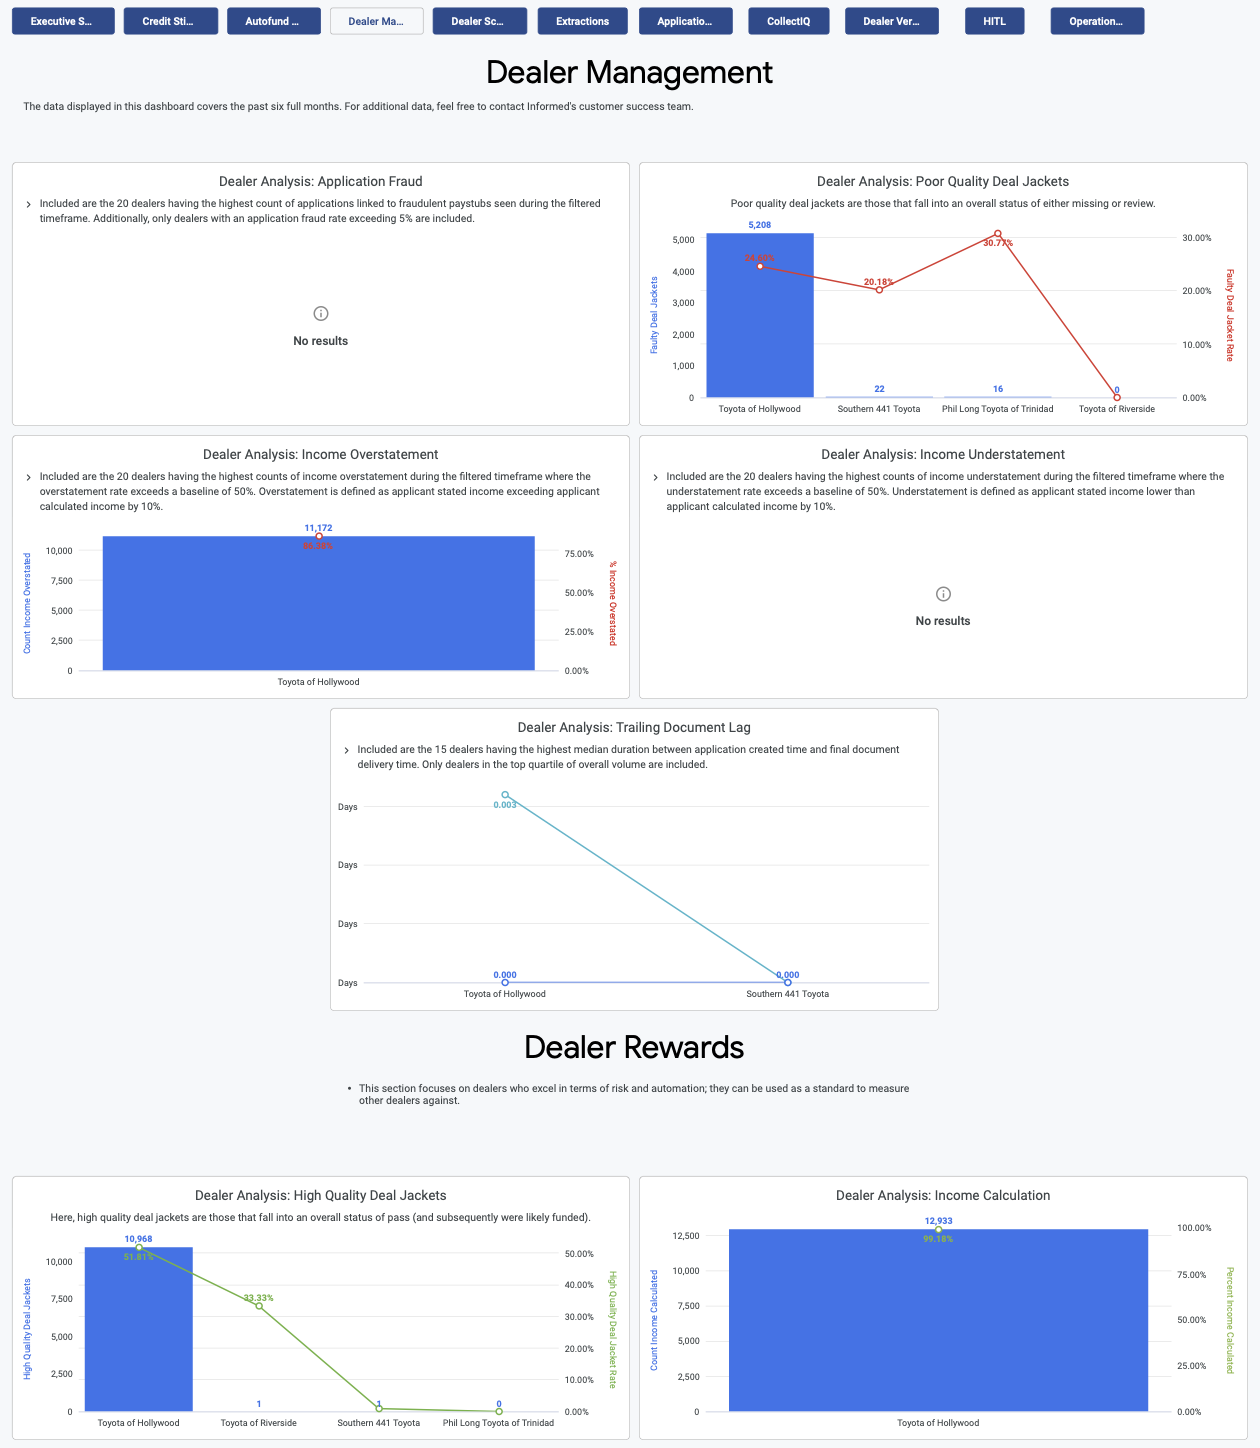
Dealer Management
The Dealer Management tab is used to identify trends of different positive and negative metrics across your dealer network. Dealers are ranked within each metric based on how often applications are being submitted with potential fraud, missing documents or overstated/understated income. Additionally, dealers are highlighted if they frequently send in complete deal packages which can be used to help facilitate dealer rewards.
- Application Fraud
- Poor Quality Deal Jackets
- Income Overstatement
- Income Understatement
- Trailing Document Lag
- High Quality Deal Jackets
- Income Calculation
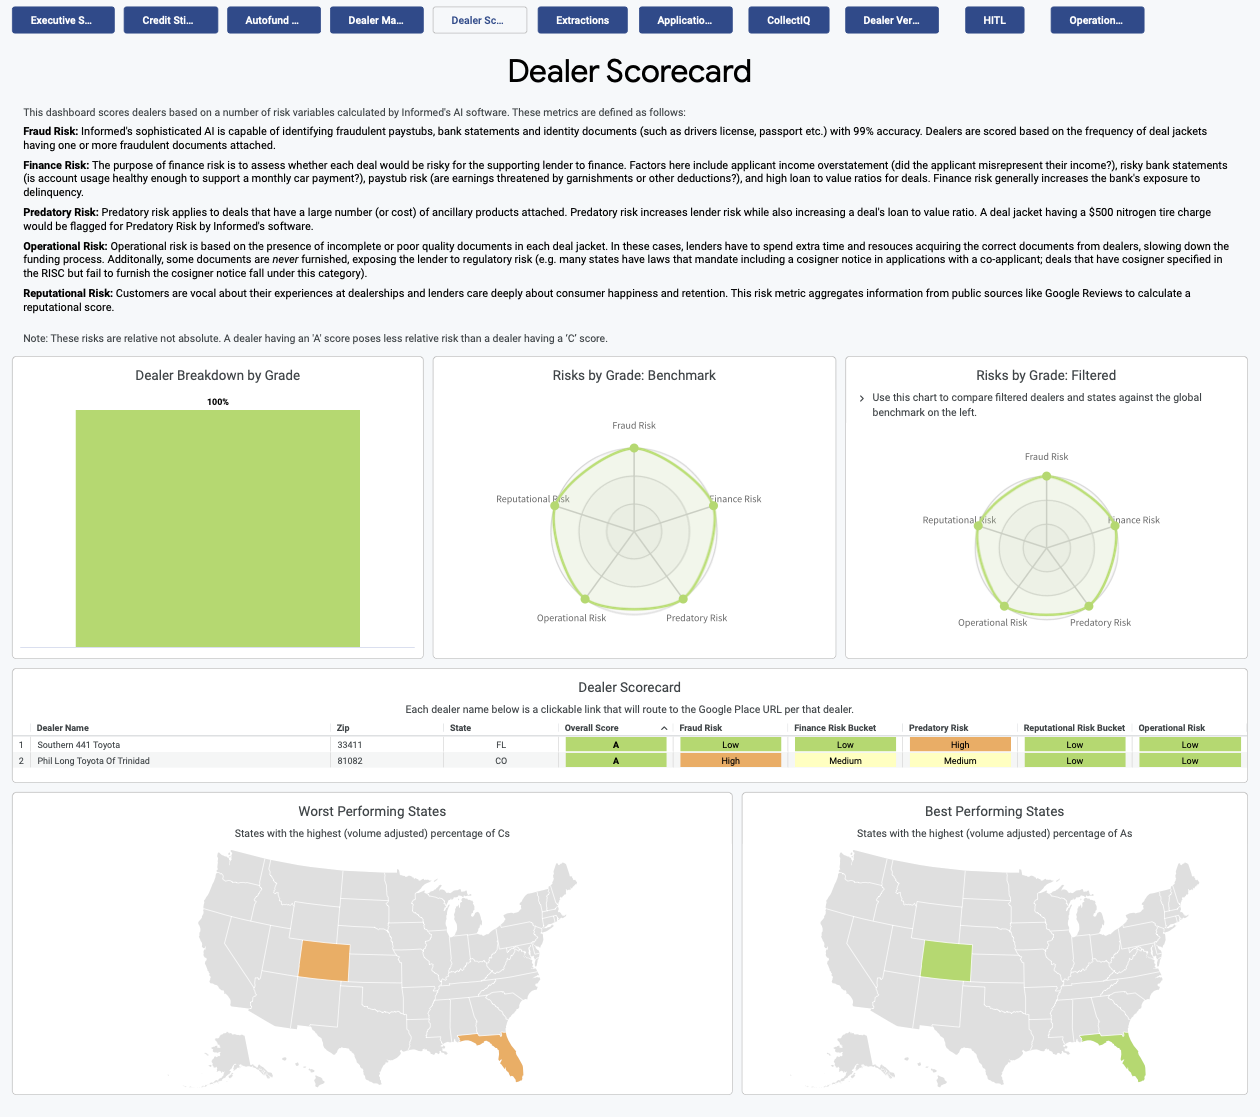
Dealer Scorecard
The Dealer Scorecard tab can be used to review different risk metrics and scores for different dealers within your footprint. The risk metrics are evaluated for each dealer and then combined to give the dealer an overall score. This information can be used to help understand how dealers in certain areas (states, zip codes) are ranked and can help provide additional context surrounding any deals that may be performing poorly.
- Dealer Breakdown by Grade
- Risks by Grade
- Benchmark
- Filtered
- Dealer Scorecard
- Worst Performing States
- Best Performing States
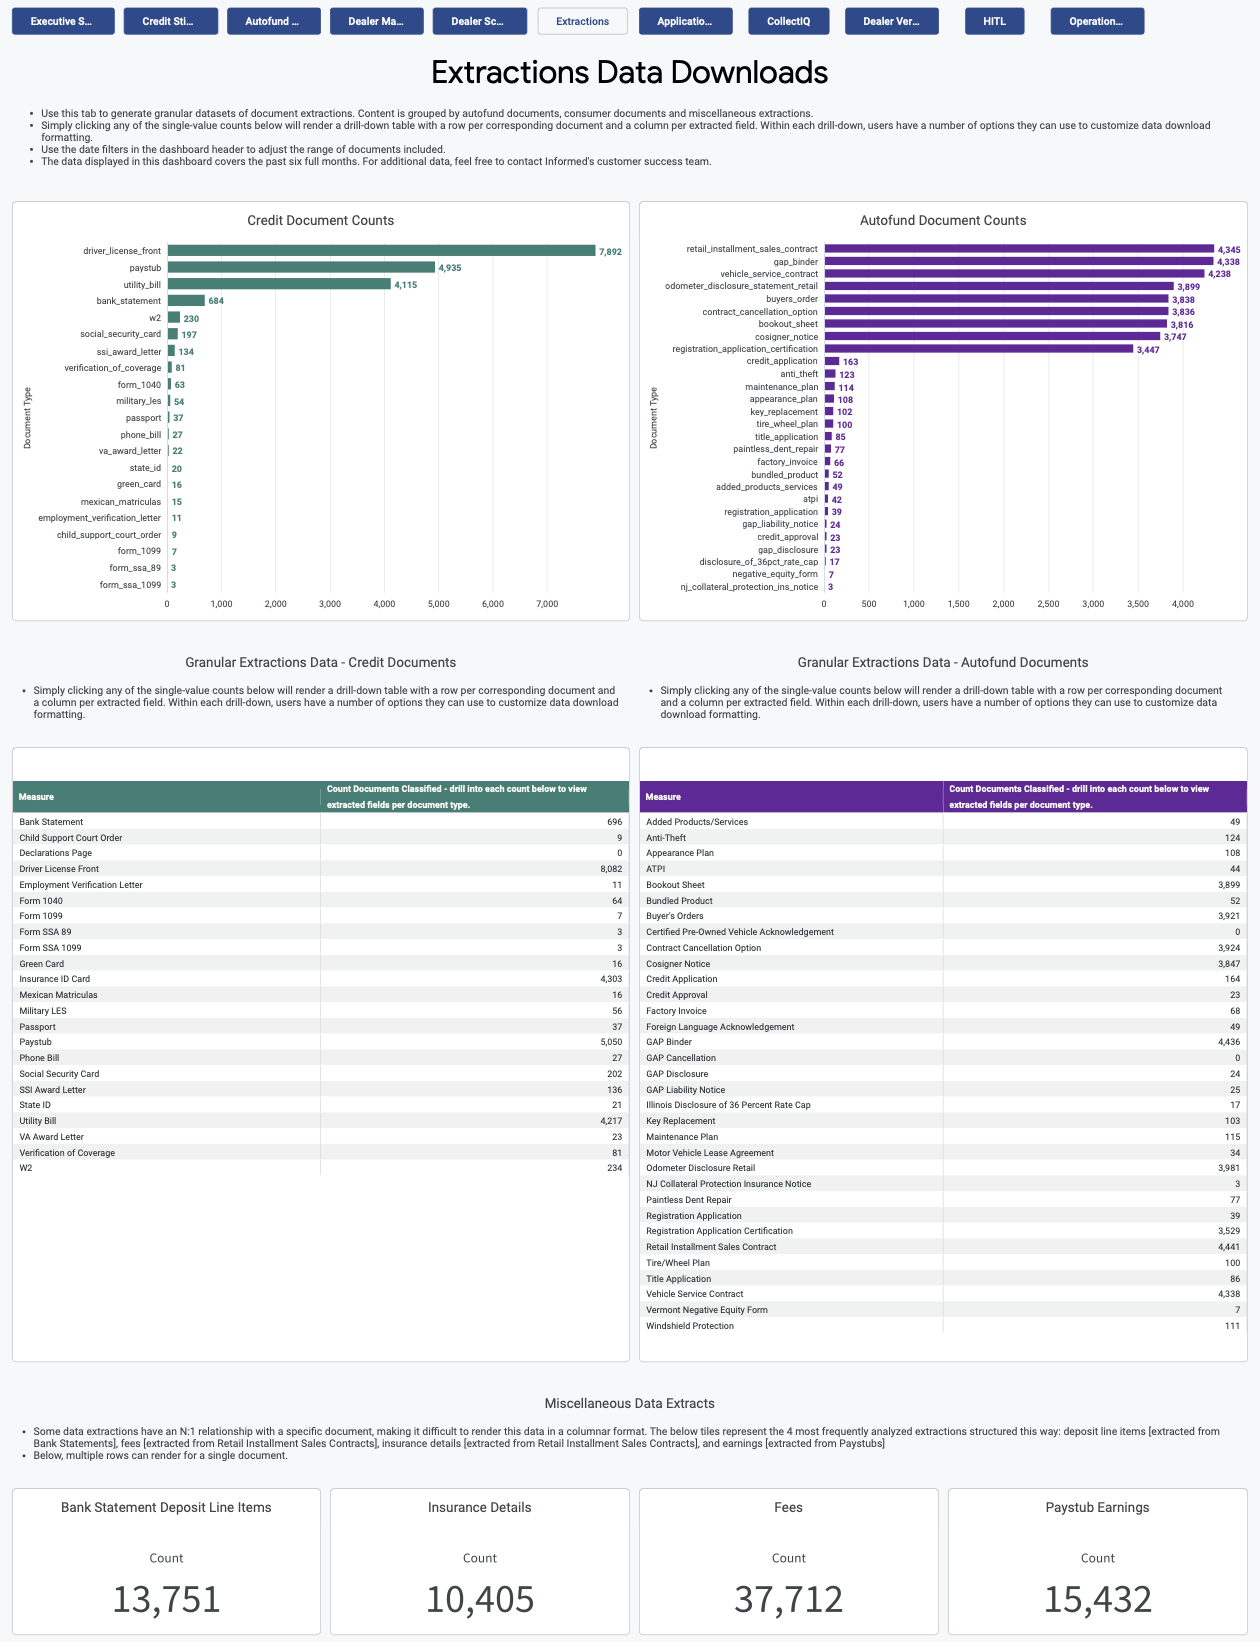
Extractions Data Downloads
The Extractions Data Downloads tab can be used to view credit document counts and AutoFund document counts or for generating granular datasets of document extractions. Simply clicking any of the single-value counts present in this tab will render a drill-down table with one row per corresponding document and one column per extracted field which can subsequently be downloaded as a file for further analysis or manipulation outside of the Insights Dashboard.
- Credit Document Counts
- Granular Extractions Data
- AutoFund Document Counts
- Granular Extractions Data
- Miscellaneous Data Extracts
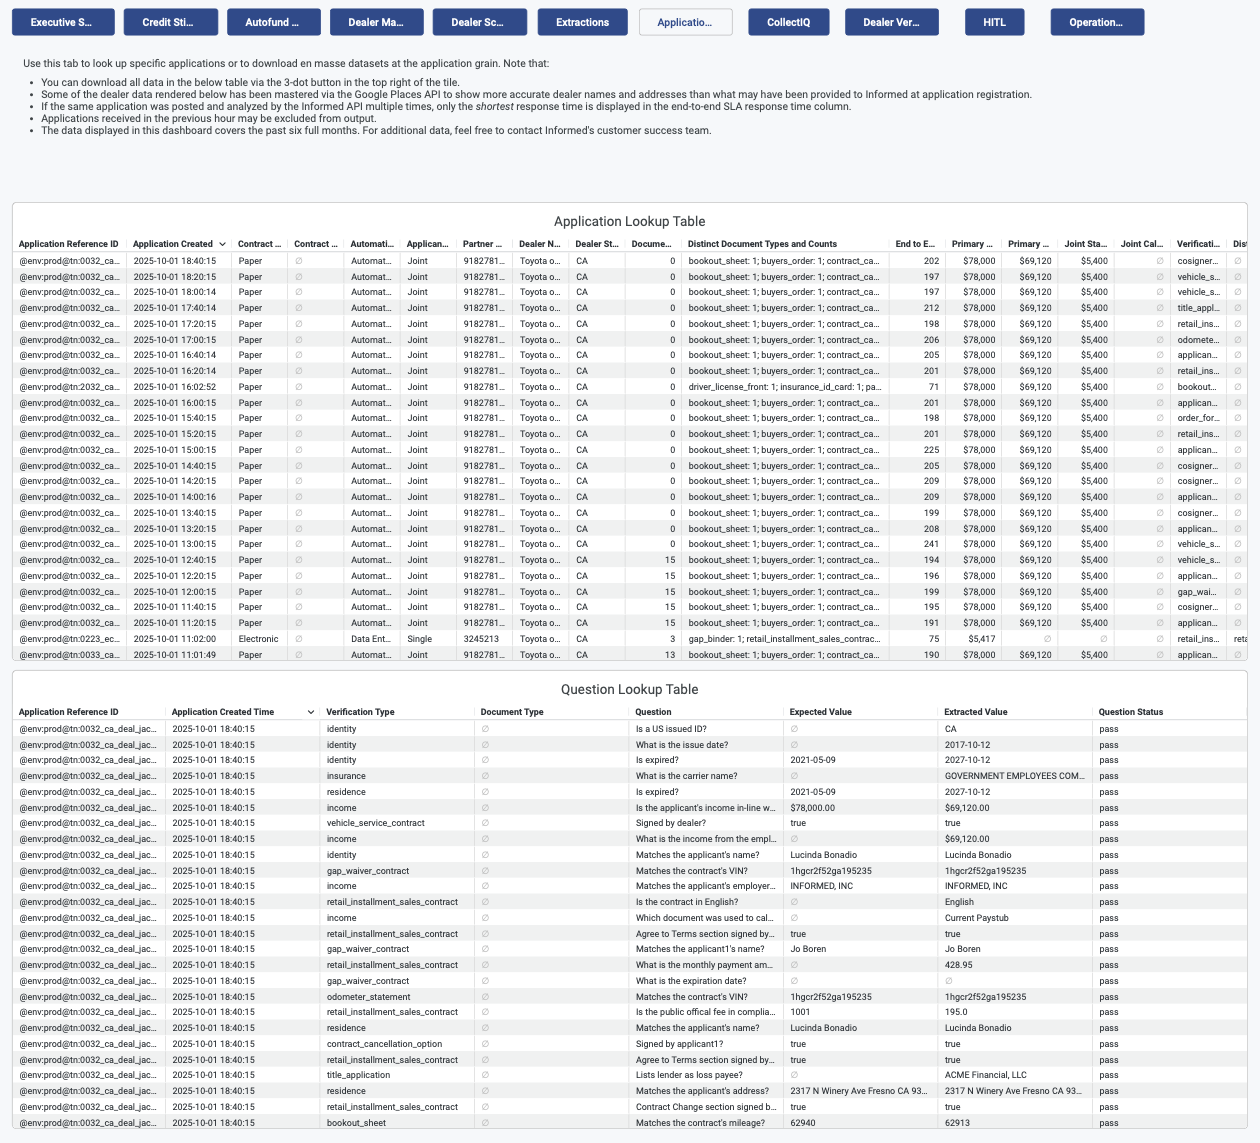
Application Lookups
The Application Lookups tab is used to look up specific applications or to download datasets at the application level. This tab provides high level application details such as stips processed and documents uploaded as well as the questions evaluated on each stip and their resulting status.
- Application Lookup Table
- Question Lookup Table
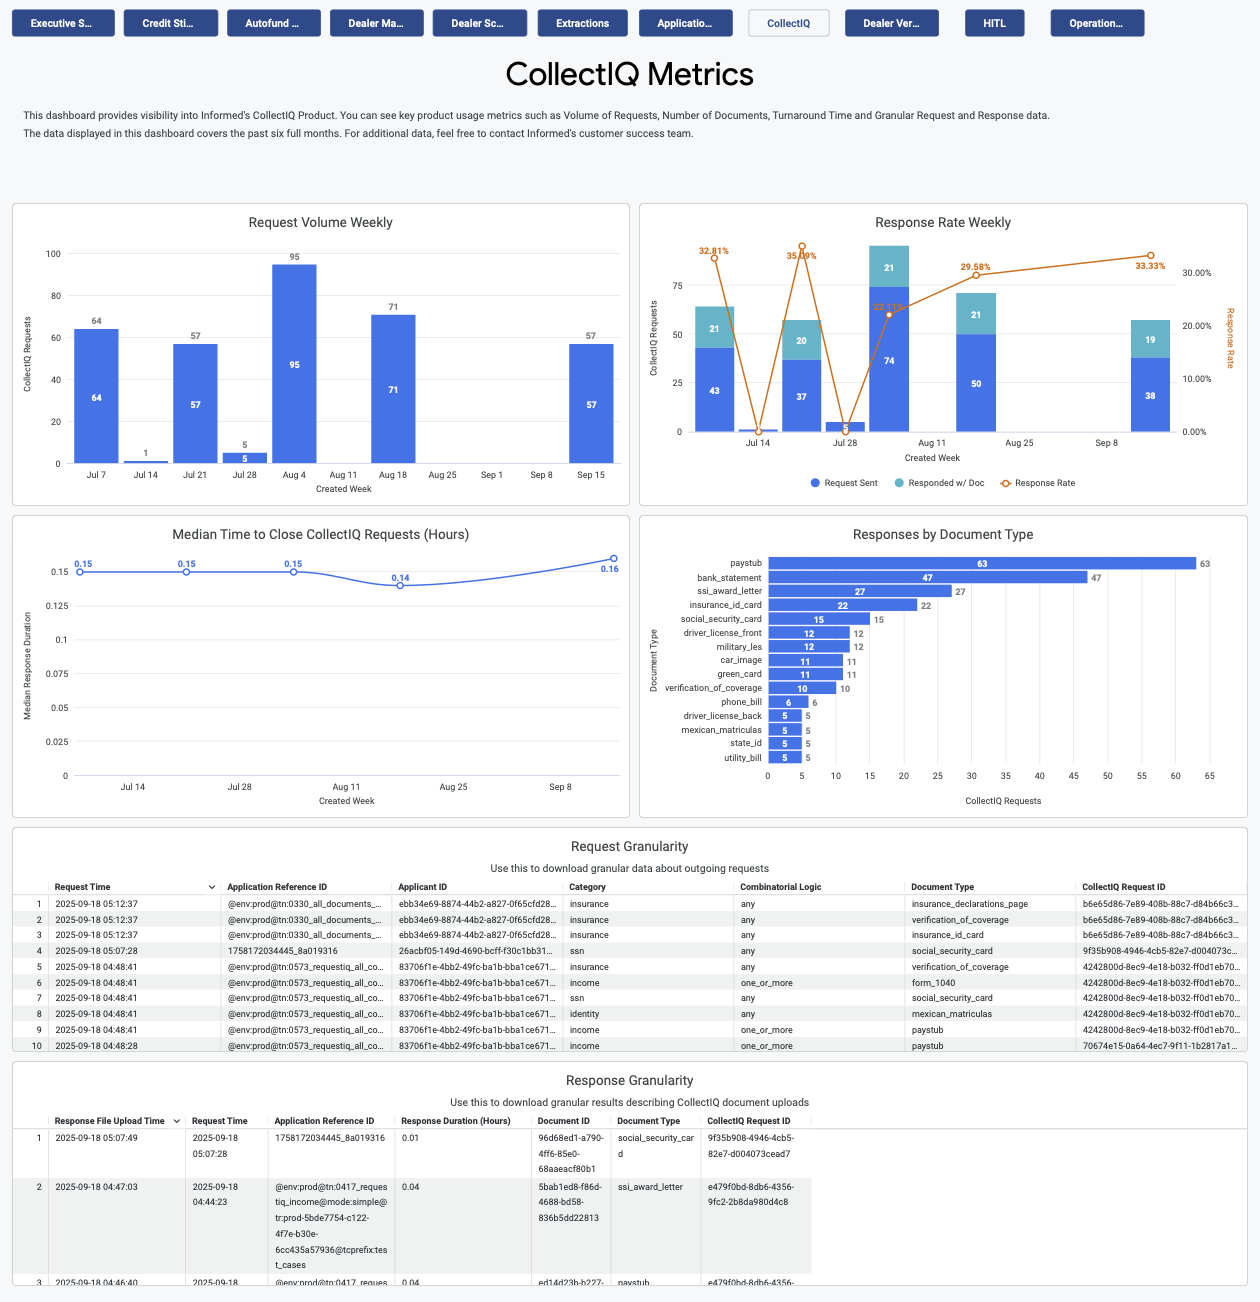
CollectIQ Metrics
The CollectIQ Metrics tab provides visibility into Informed's CollectIQ Product. You can see key product usage metrics such as request volume, documents collected, turnaround time and granular request and response data. Data will only be populated in this tab if you are actively using the CollectIQ product. Please contact your Account Manager if you are interested in leveraging this solution.
- Request Volume Weekly
- Response Rate Weekly
- Median Time to Close CollectIQ Requests
- Responses by Document Type
- Request Granularity
- Response Granularity
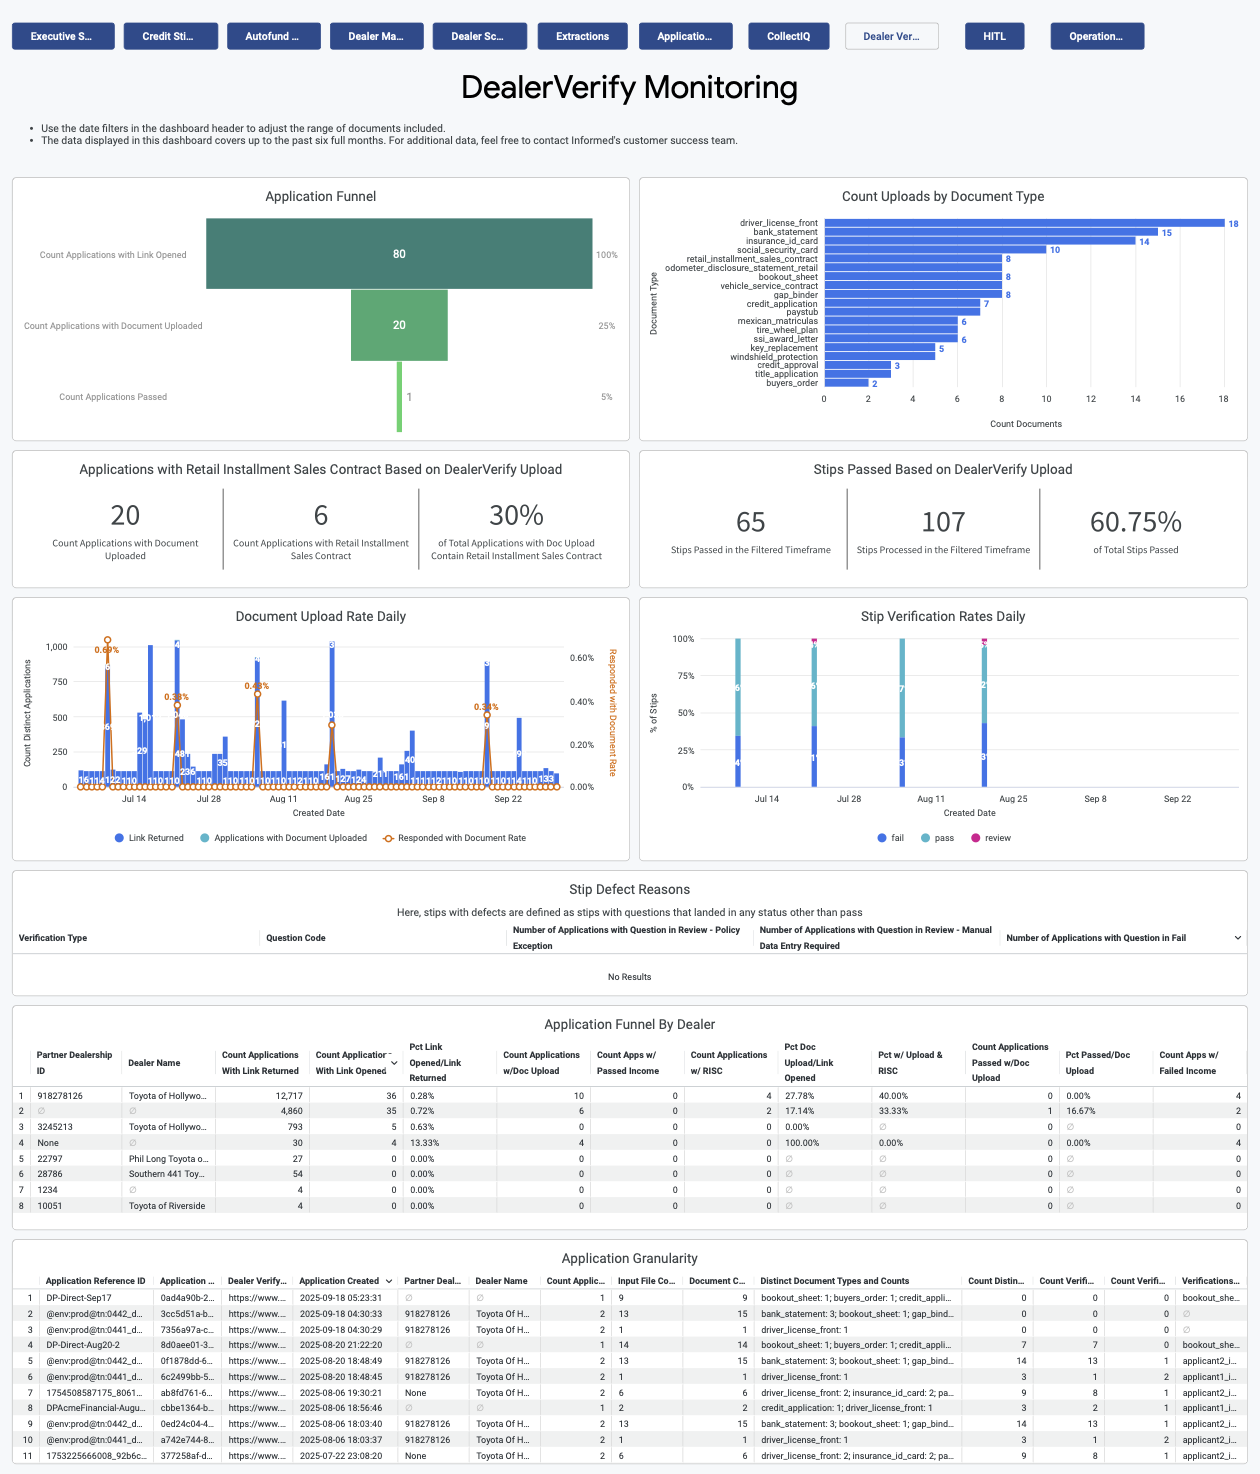
DealerVerify Monitoring
This tab provides visibility into Informed's DealerVerify Product. You can see key product usage metrics such as links returned, links clicked, documents uploaded via DealerVerify and request and response data. Data will only be populated in this tab if you are actively using the DealerVerify product. Please contact your Account Manager if you are interested in leveraging this solution.
- Application Funnel
- Count Uploads by Document Type
- Document Upload Rate Daily
- Stip Verification Rates Daily
- Stip Defect Reasons
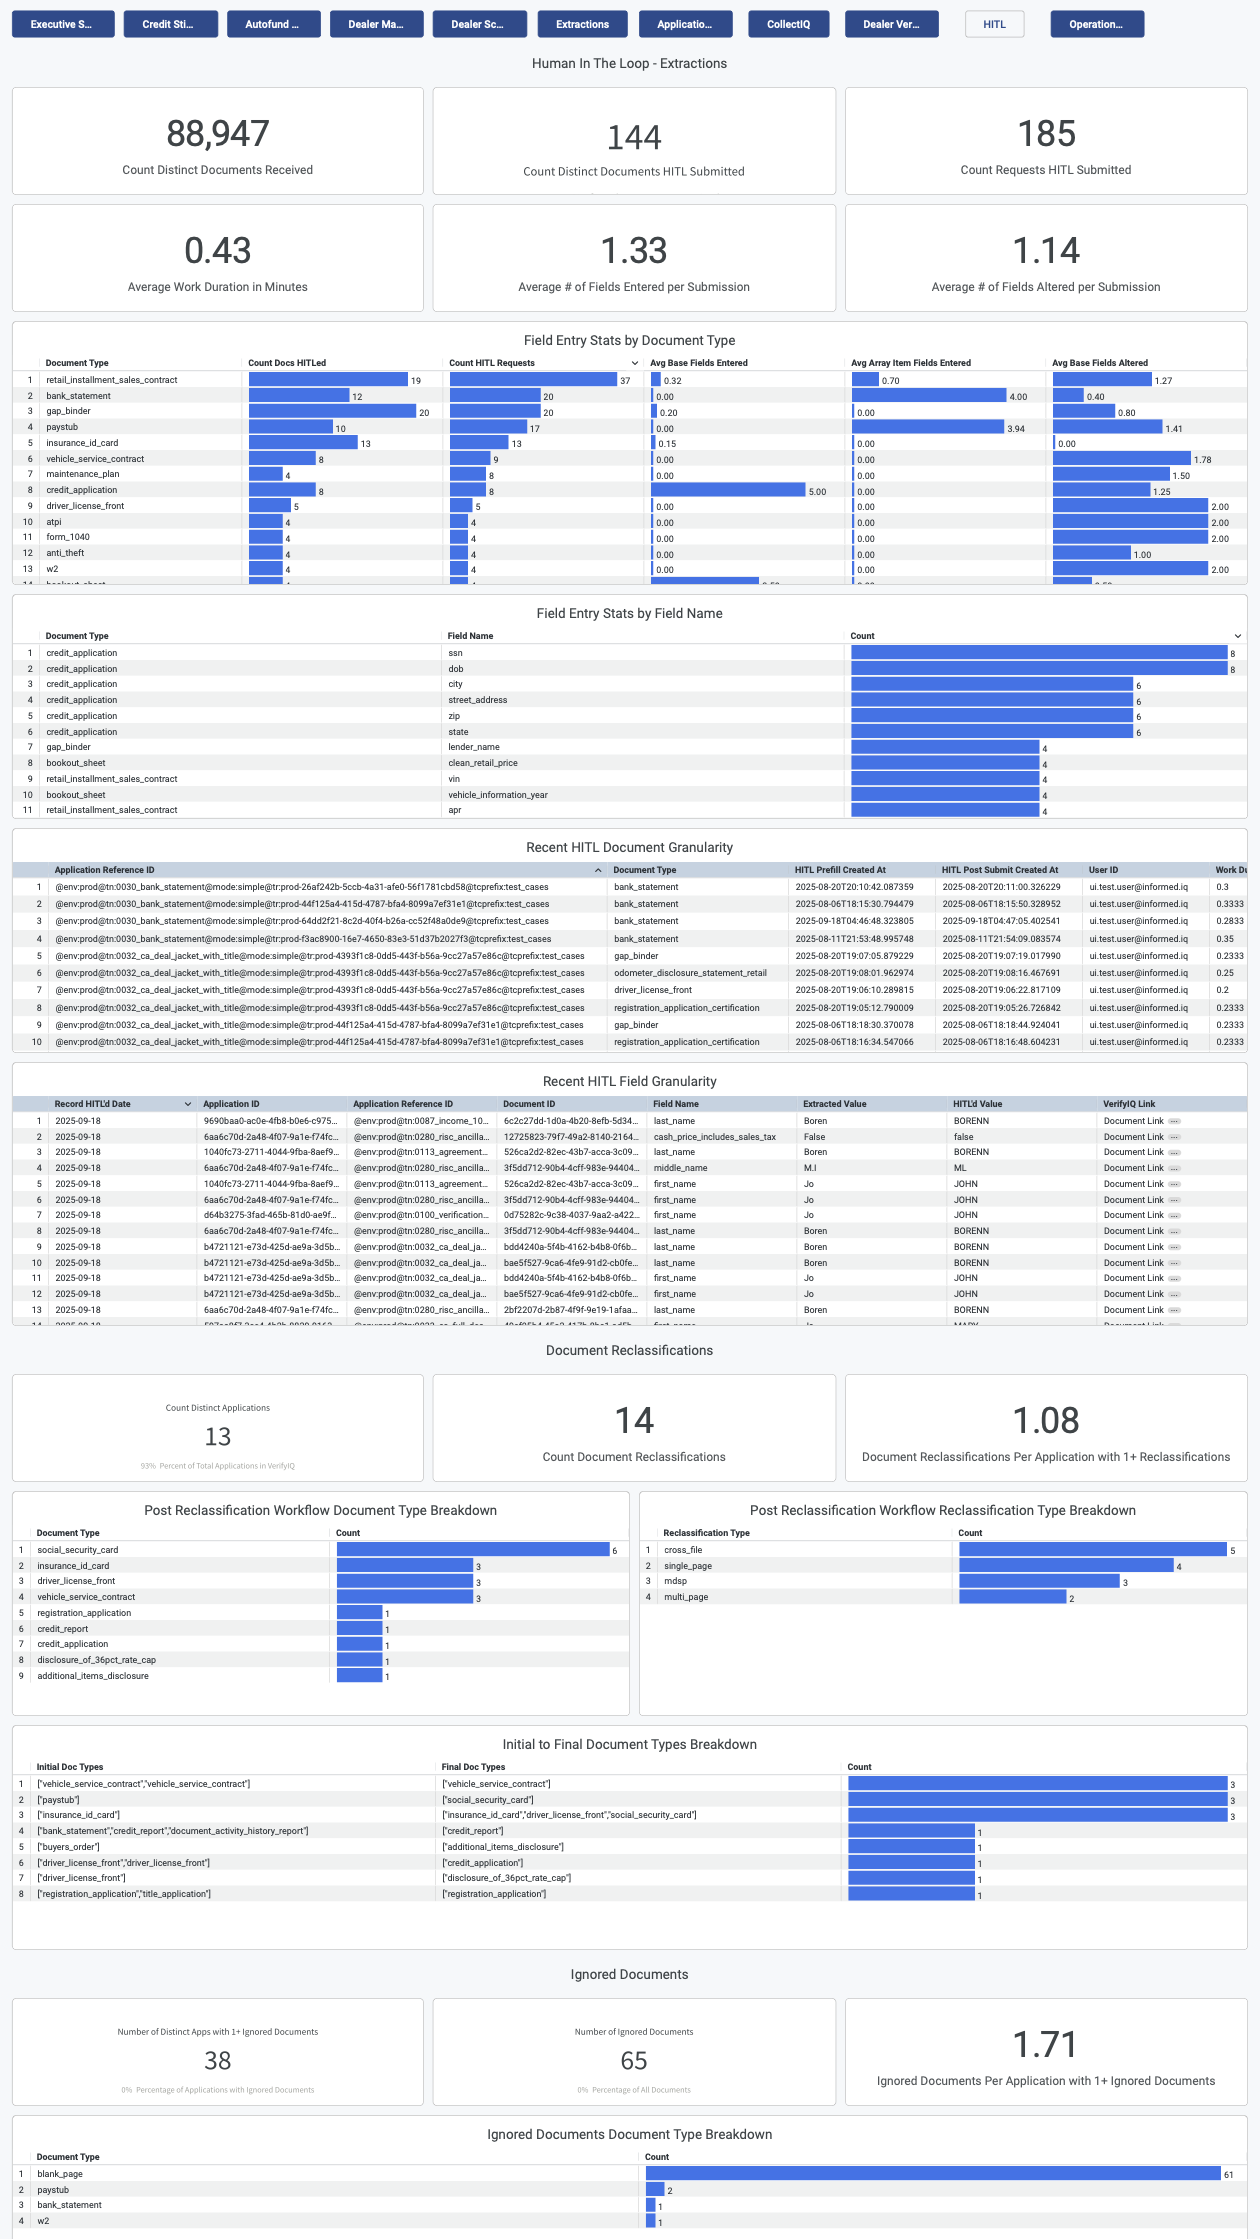
Human-In-The-Loop (HITL) Monitoring
The Human-in-the-loop (HITL) Monitoring tab shows metrics that focus on the impact of human activity to the application process, most commonly adjusted parameters and work efforts and performance of users within the platform. Data will only be populated in this view if users are working directly in VerifyIQ to edit documents and override verifications.
The detailed charts within each section give granular views on actions taken as well as responsible users.
- HITL Extractions
- Document Reclassifications
- Ignored Documents
- Verification Question Overrides
- Verification Overrides
- Work Session Overview
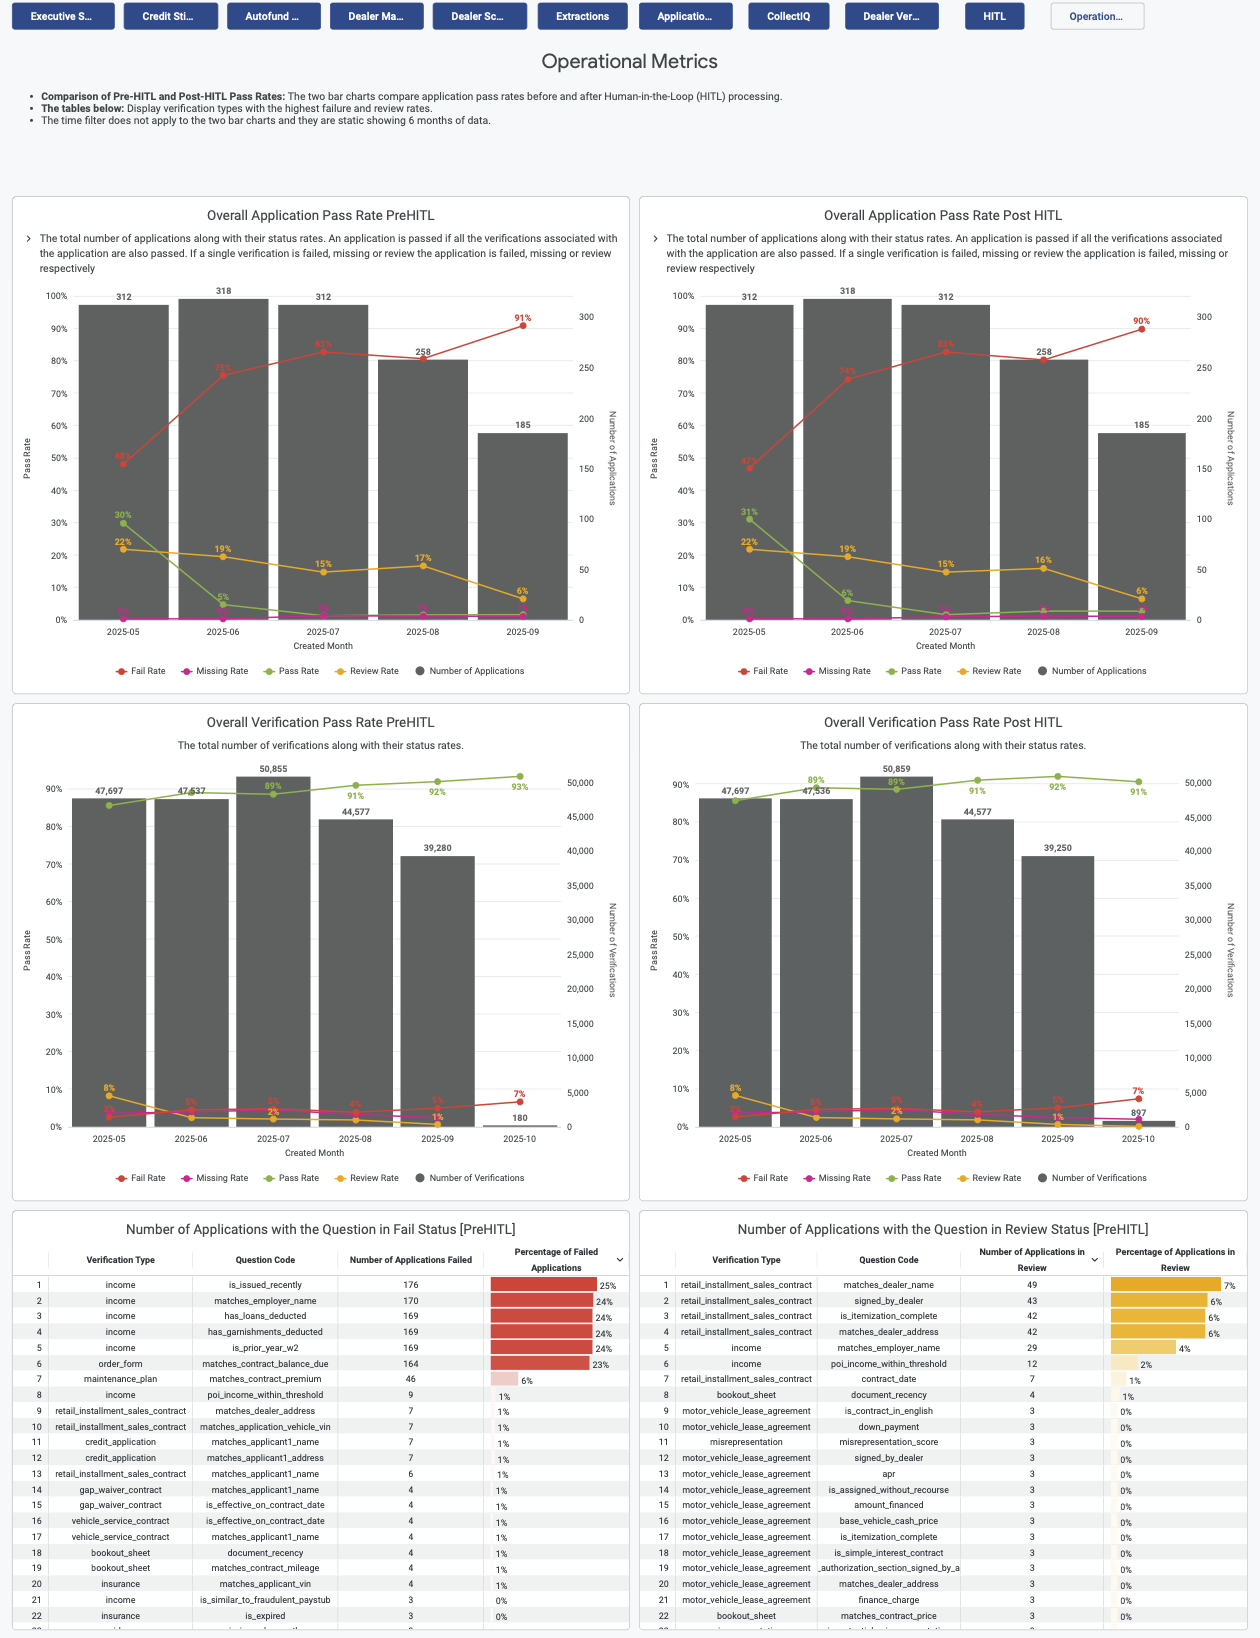
Operational Metrics
The Operational Metrics tab shows a summary view of Pre- and Post-HITL pass rates. The bar charts compare application pass rates before and after Human-in-the-Loop (HITL) processing. The tables on the page display verification types with the highest failure and review rates.
- Overall Application Pass Rate Pre-HITL
- Overall Application Pass Rate Post-HITL
- Overall Verification Pass Rate Pre-HITL
- Overall Verification Pass Rate Post-HITL
- Number of Applications with the Question in Fail Status [Pre-HITL]
- Number of Applications with the Question in Review Status [Pre-HITL]
The time filter does not apply to the two bar charts because they show a static 6 months of data.